Digital Traces of Gentrification
Capstone Project Website
What is Gentrification?
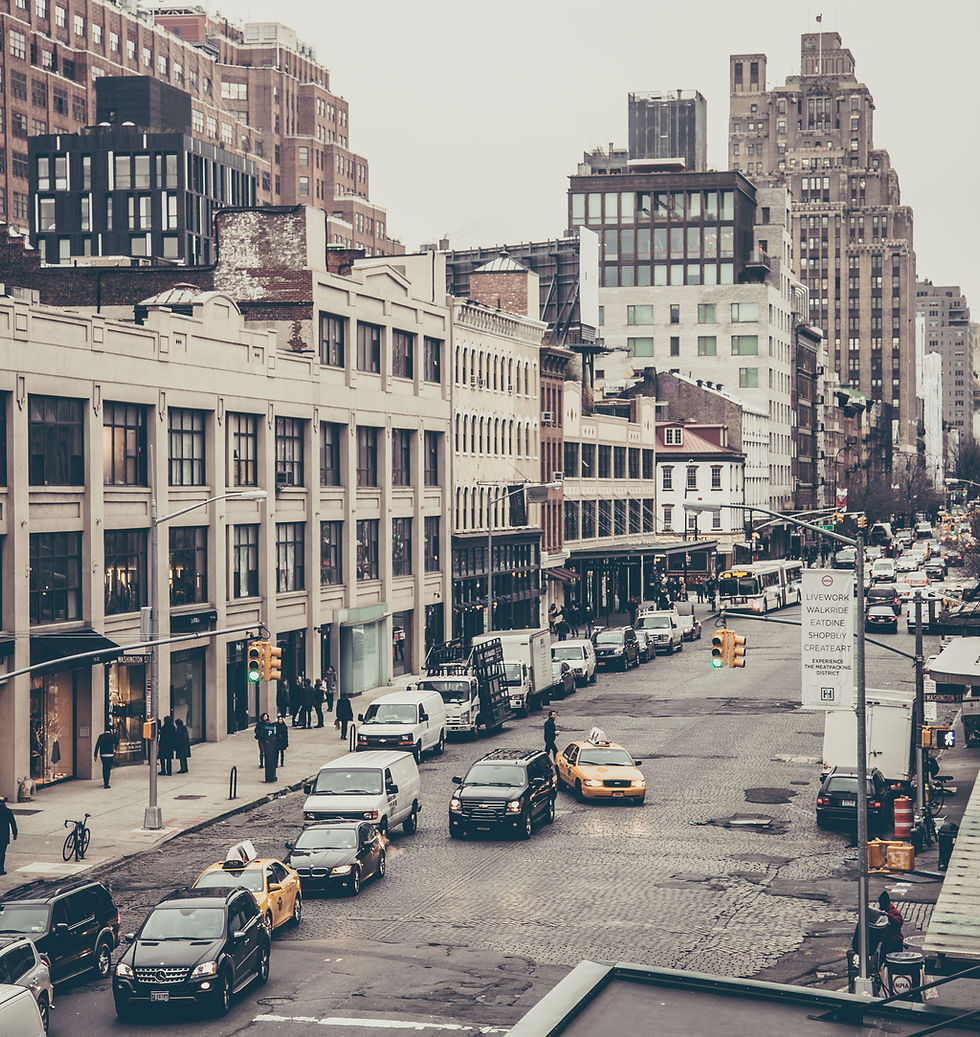
New York City has a lot of neighborhoods that are rapidly changing, generating a transformation of the urban environment and economic activities in them. But it is not all good; this renovation also generates an increase in the average rent prices and potentially the displacement of low-income people who live in those. This process is called gentrification.
What did we do?
In this project we wanted to find out if there is a way to know where gentrification is happening based on the indicators of human behavior. So we took a bunch of open-source data and developed some target variables for gentrification. And then related these to human behavior data. After running some boring but interesting statistical techniques we find that there are actually some variables that can help explain gentrification!
Want to learn more?
You can check out the target variables and relevant features found after modeling in the (super cool) interactive map, or if you are interested in the whole thing just go to the (super interesting) final document (there’s a link). Hope you enjoy it!
Choose an indicator from this drop down menu to see the corresponding Cloropleth map of New York City
Click on each zipcode of the map to see the corresponding indicators
The Program
The Center for Urban Science And Progress (NYU CUSP) is a unique public-private research center that uses New York City as its laboratory and classroom to help cities around the world become more productive and livable.
The Mentor
Dr. Stanislav Sobolevsky is an Associate Professor of Practice at the Center for Urban Science and Progress at New York University and a Research Affiliate at the MIT Senseable City Lab. He holds a Ph.D (1999) from Grodno State University and a Doctor of Science (2009) in Mathematics from the National Science Academy of Belarus.
Juan Sokoloff
Economics Undergrad from the Universidad de Los Andes, Has a passion for Urban Economics. Currently working on his Masters degree from NYU CUSP
Baoling Zhou
Undergrad from Boston University majoring in Accounting and Finance. Currently working on her Masters degree from NYU CUSP
Lingyi Zhang
Undergrad from Minzu University of China. Also has a Master of Arts in Management, majoring in Technology, Economics and Management. Curretly working on her Masters degree from NYU CUSP
Srikanth Namuduri
Experienced engineer, project manager and data scientist. Holds a Master of Science degree in Electronics and Computer Engineering from University of Louisville. Currently working on a Advanced Certificate from NYU CUSP
Research Approach

Target Variables
Building renewal :We developed two target variables to help us define this. The number of New Building Permits divided by the Total Number of permits and the number of Major Renovation Permits divided by the Total Number of permits.
Economic transformation: There is one target variable reflecting this, given by the number of New Business licenses applications divided by the number of Renewal licenses for existing buildings.
Rent increase: Again, one target variable, showing how much did rent change between 2013 and 2017 in any Zip Code.
An Index for Gentrification
All the target variables have been used in previous literature to describe gentrification, but we didn’t find anyone who combined all these characteristics into just one measure, so we went ahead and did it. We defined what we called a Gentrification Index, and it multiplies the Building renewal features divided by the square root of the zip code’s area with the Economic transformation and Rent Increase indexes to result in one unique number that describes the gentrification rate of a zip code.
Features
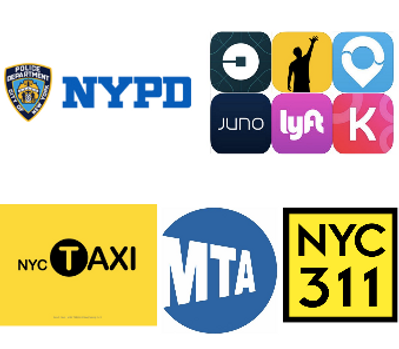
Our features are human behavior variables coming from 311 complaints (oh yes, some people complaint more than other), NYPD crime statistics (no one wants to get robbed!), transportation statistics (if you are cool you don’t take the subway) and a commercial activity variable (it comes from a credit card provider, not allowed to say which, shhh). We use these to fit our target variables and see if there is a good fit.
Modeling
We had a lot of features, so our main purpose was to see which of these were the most useful, and also significant for predicting our target variables. We used a Linear Support Vector Classifier, and picked the top 5 features in Random Forest and Gradient Boosting to find out the relevant features. Then checked their significance and coefficients using OLS models.

Conclusion
We found that there are some human behavior features that are correlated to the level of gentrification. Particularly there is a list of 6 that can be outlined. Transportation Complaints per square mile, Commercial activity growth, Vehicle Parking complaints per capita, number of Taxi Trips normalized per square mile, Robbery per capita and Home Complaints per square mile.
Next Steps
In the future we hope a lot of you visit the website, also an exploration can be made to see if this features can not only be correlated to gentrification, but also used to predict where is it going to happen. Please ask us about this in a couple years, or if you do it first, share!